Experimente
Experimente#
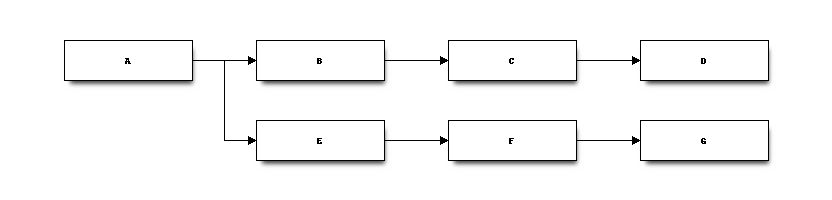
Abb. 53 Beispiel blockdiag#
Abb. 54 Beispiel actdiag#
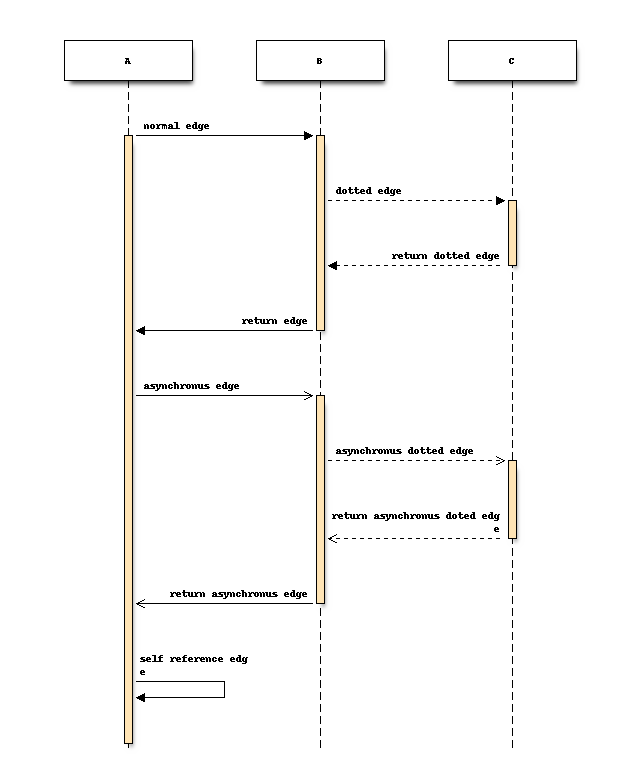
Abb. 55 Beispiel seqdiag#
![digraph {
"Indikation"
[
shape=diamond,
color=black,
style=filled,
fillcolor=grey,
fontcolor=black,
fontname="Source Sans Pro",
label="Indikation",
];
"HDM1"
[
shape=folder,
color=mediumblue,
style=filled,
fillcolor=mediumblue,
fontcolor=white,
fontname="Source Sans Pro",
label="HDM",
];
"HDM2"
[
shape=folder,
color=mediumblue,
style=filled,
fillcolor=mediumblue,
fontcolor=white,
fontname="Source Sans Pro",
label="HDM",
];
"Analyse"
[
shape=diamond,
color="#ccffcc",
style=filled,
fillcolor="#ccffcc",
fontcolor=white,
fontname="Source Sans Pro",
];
"schockbar"
[
shape=note,
color=coral,
style=filled,
fillcolor=coral,
fontcolor=white,
fontname="Source Sans Pro",
label="schockbarer Rhythmus",
];
"Schock"
[
shape=box,
color=red,
fontcolor=red,
fontname="Source Sans Pro",
label="Schock",
];
"nichtschockbar"
[
shape=box,
color=coral,
style=filled,
fillcolor=coral,
fontcolor=white,
fontname="Source Sans Pro",
label="nicht-schockbarer Rhythmus",
];
Meet
[shape = circle, label=""];
Indikation -> HDM1 -> Analyse;
Analyse -> nichtschockbar -> Meet;
Analyse -> schockbar -> Schock -> Meet;
Meet -> HDM2-> Analyse [label=" 2 min"];
}](../../_images/graphviz-a9689812c5e18f766f372e77986e6cfc98aae93f.png)
Abb. 56 Quelltextordner#
Abb. 57 Beispiel actdiag#
Dieses Werk ist lizenziert unter der Creative Commons Namensnennung - Weitergabe unter gleichen Bedingungen 3.0 Österreich Lizenz (CC BY-SA 3.0 AT). Einzelne Beiträge und Medien können abweichend lizensiert sein.